Kenny Croxdale
Level 7 Valued Member
Forrce-Velocity Curve
Force-Velocity Curve - Science for Sport
Contents of Article
Rugby Renegade | Rugby Strength and Conditioning - The Force Velocity Curve

The curve itself shows an inverse relationship between force and velocity, meaning that an increase in force would cause a decrease in velocity and vice versa. Giving an example, a one repetition maximum (1RM) Back Squat would produce high levels of force but would be lifted at a slow velocity. While a countermovement jump (CMJ) would produce a high movement velocity, it would also only produce low-levels of force. This indicates that there is a trade-off between force and velocity. That being, when an exercise produces high levels of force, it will also produce a slow movement velocity and vice versa.
This trade-off between force and velocity is thought to occur due to a decrease in the time available for cross bridges to be formed – more time equals more cross bridges, and more cross bridges mean a greater contractile force (1). Therefore, slower velocity exercises allow the athlete to form more cross bridges and develop more force. Higher velocity exercises provide less time for cross bridges to form, and therefore results in lower force production. As a result, different exercises and intensities have been categorised into various segments on the force-velocity curve (Figure 1). In addition, Table 1 demonstrates the force and velocity differences between numerous exercises. Here try and note the force and velocity differences between the same exercises at various intensities.

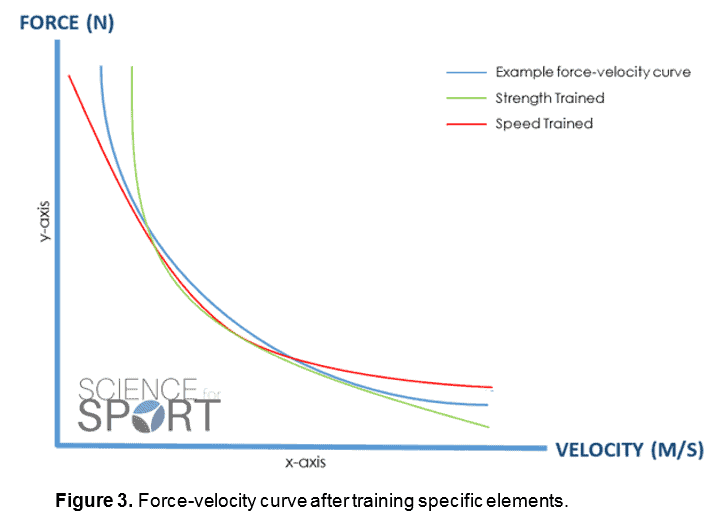
By only training on one part of the force-velocity curve (e.g. maximum strength), it is likely that the athlete will only improve their performance at that section on the paradigm (Figure 3). For example, only training maximal strength may lead to improvements in force production, but it may also result in a reduction in muscle contractile velocity. As training programmes which combine strength and power training have been repeatedly shown to improve athletic performance more than strength or speed training alone (13), there is no surprise that most strength and conditioning coaches commonly use an all-rounded approach within their programming.
Although most athletes should typically train at each section along the force-velocity curve, the time spent at each zone is dependent on many factors. Some primary considerations include:
Force-Velocity Curve - Science for Sport
Contents of Article
- Summary
- What is the Force-Velocity Curve?
- Practical Application
- The Training Zones (Sections of the Force-Velocity Curve)
- Conclusion
- References
- About the Author
- Comments
Summary
The force-velocity curve is a physical representation of the inverse relationship between force and velocity. Understanding the interaction between force and velocity and their influences on exercise selection is vital for any strength and conditioning professional. For example, it is essential that a strength and conditioning coach understands the physiological and biomechanical differences between prescribing a 1RM deadlift and 5RM jump squats – as one will produce higher forces and lower velocities than the other. Failure to understand the relationship and its importance will likely lead to less than optimal training prescription.Rugby Renegade | Rugby Strength and Conditioning - The Force Velocity Curve
What is the Force-Velocity Curve?
Though the force-velocity curve may appear confusing and complicated, it is actually very straight-forward. The force-velocity curve is simply a relationship between force and velocity and can, therefore, be displayed on an x-y graph (Figure 1). The x-axis (i.e. horizontal axis) indicates velocity, for example, this may represent muscle contraction velocity, or velocity of movement (measured in meters per second). Whilst the y-axis (i.e. vertical axis) indicates force, for example, this may represent muscle contractile force, or the amount of ground reaction force produced (measured in Newtons).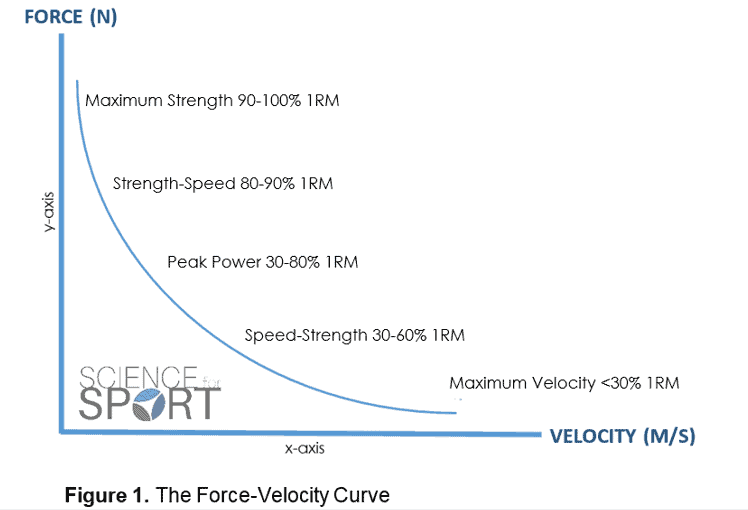
The curve itself shows an inverse relationship between force and velocity, meaning that an increase in force would cause a decrease in velocity and vice versa. Giving an example, a one repetition maximum (1RM) Back Squat would produce high levels of force but would be lifted at a slow velocity. While a countermovement jump (CMJ) would produce a high movement velocity, it would also only produce low-levels of force. This indicates that there is a trade-off between force and velocity. That being, when an exercise produces high levels of force, it will also produce a slow movement velocity and vice versa.
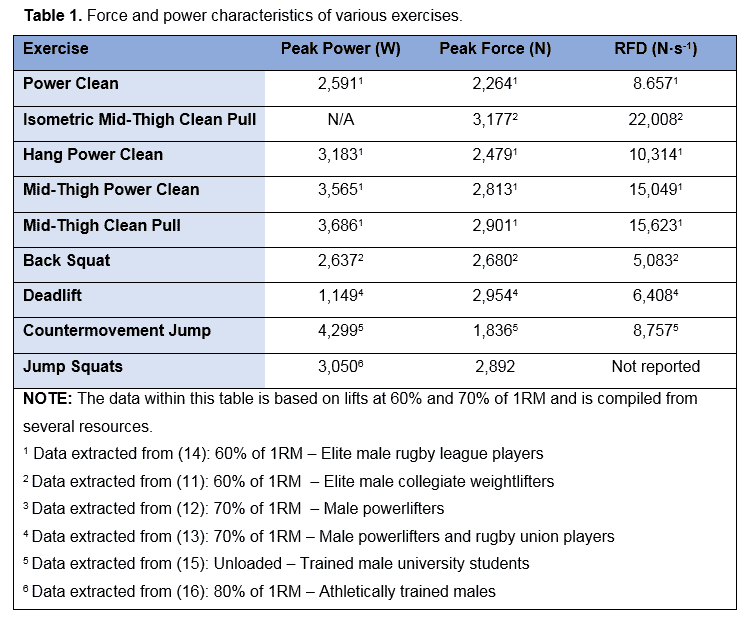
This trade-off between force and velocity is thought to occur due to a decrease in the time available for cross bridges to be formed – more time equals more cross bridges, and more cross bridges mean a greater contractile force (1). Therefore, slower velocity exercises allow the athlete to form more cross bridges and develop more force. Higher velocity exercises provide less time for cross bridges to form, and therefore results in lower force production. As a result, different exercises and intensities have been categorised into various segments on the force-velocity curve (Figure 1). In addition, Table 1 demonstrates the force and velocity differences between numerous exercises. Here try and note the force and velocity differences between the same exercises at various intensities.
Practical Application
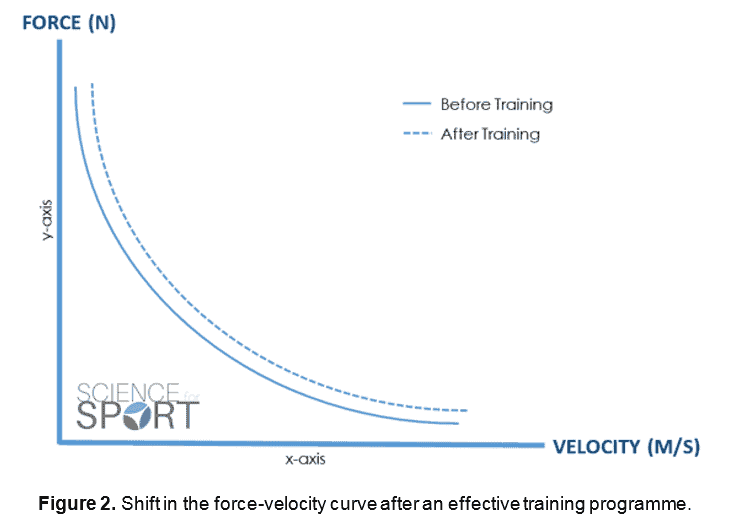
As power is a key determinant in the performances of many sports, optimising an athlete’s power production is of great importance (7, 8, 9, 10, 11, 12). Because power is the product of force multiplied by velocity (Power = Force * Velocity), improving either of these components can lead to increased power production and therefore the explosiveness of the athlete. In most circumstances, the primary objective of strength and power training is to shift the force-velocity curve to the right (Figure 2), resulting in the athlete being able to move larger loads at higher velocities and therefore becoming more explosive. Shifting the force-velocity curve to the right represents an improved rate of force development (RFD). The RFD simply reflects how fast an athlete can develop force. An athlete with greater RFD capabilities will be more explosive as they can develop larger forces in a shorter period of time.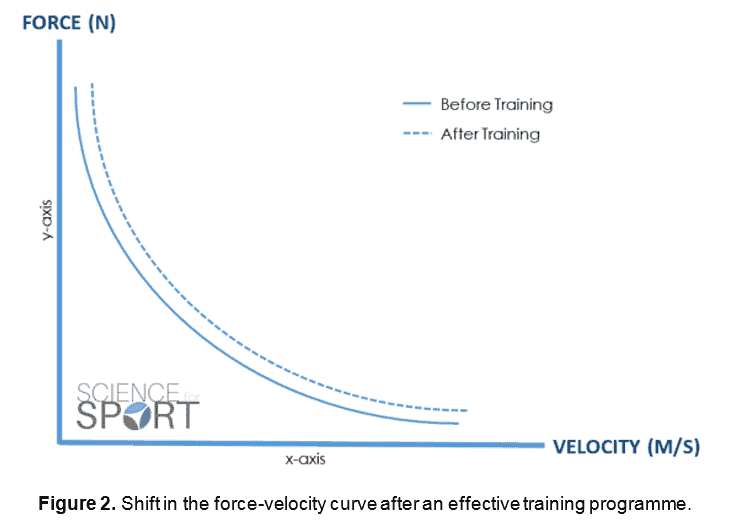
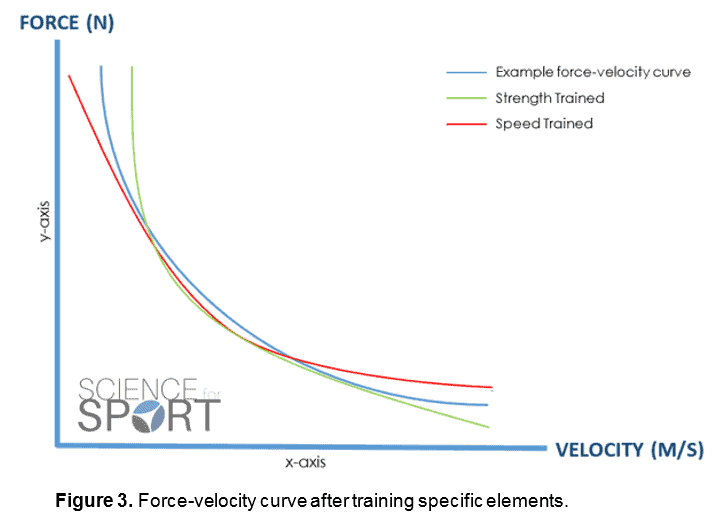
By only training on one part of the force-velocity curve (e.g. maximum strength), it is likely that the athlete will only improve their performance at that section on the paradigm (Figure 3). For example, only training maximal strength may lead to improvements in force production, but it may also result in a reduction in muscle contractile velocity. As training programmes which combine strength and power training have been repeatedly shown to improve athletic performance more than strength or speed training alone (13), there is no surprise that most strength and conditioning coaches commonly use an all-rounded approach within their programming.
Although most athletes should typically train at each section along the force-velocity curve, the time spent at each zone is dependent on many factors. Some primary considerations include:
- Training age
- Individuals strengths and weaknesses
- Training objectives
- The sport and position of the athlete
- Time of year/ season/ stage of the macrocycle