all posts post new thread

Off-Topic How have you been doing?

Status
Closed Thread. (Continue Discussion of This Topic by Starting a New Thread.)

Hung

Level 8 Valued Member


Based on the survey a few years ago I build this report (click to the link above). Thanks damogari for sharing the data.
The report has three pages

In the survey some of you guys had your target weight. Soooo did you achive that?

Note on how to use:
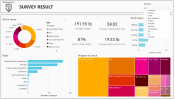
Power Bi report is dynamic: if you point the mouse to a column/part of a visual it will show the value of that column
Point the mouse.png

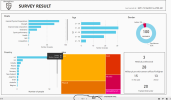
You could choose the country in here
Choose the country if you wish.png

You can click to a part of one visual and all other visuals will be filtered based on the data you just choose. For example in the picture below, I click to "Improve body composition" and the percentage of diet, weight, program of choice...now are from the people who has "Improve body composition" goal. To redo just re-click to the place you just choose
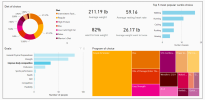
Click to visual.PNG

Tell me what you guys think :)
Note: Just update the link
 
Last edited:
Amazing information and very well presented, congratulations for your work.

When did the survey take place? Maybe its time to do another one?
 
I put the survey together along with another member. The link to it is still out there. And when new results come in (very rarely) I update the graphs. the intent being to be able to display data in order to answer questions or maybe illustrate what our members do in response to a question or topic.
It’s a bit clunky. The way it was designed unfortunately allowed vague and or incomplete answers in some categories.
I would do it differently next time around...

@q.Hung did a good job of using Power BI
It takes quite a time to clean the data.

Seems like there is no way for me to pull the data from the survey to PBI except by downloading the result sheet.

Thank you for the compliment Offwidth; hope that you don't feel offended when I approach damogari for getting data :)
 
It takes quite a time to clean the data.

Seems like there is no way for me to pull the data from the survey to PBI except by downloading the result sheet.

Thank you for the compliment Offwidth; hope that you don't feel offended when I approach damogari for getting data :)
No worries mate...


Based on the survey a few years ago I build this report (click to the link above). Thanks damogari for sharing the data.
The report has three pages

In the survey some of you guys had your target weight. Soooo did you achive that?

Note on how to use:
Power Bi report is dynamic: if you point the mouse to a column/part of a visual it will show the value of that column

View attachment 13186

You could choose the country in here
View attachment 13184

You can click to a part of one visual and all other visuals will be filtered based on the data you just choose. For example in the picture below, I click to "Improve body composition" and the percentage of diet, weight, program of choice...now are from the people who has "Improve body composition" goal. To redo just re-click to the place you just choose
View attachment 13185

Tell me what you guys think :)
Note: Just update the link
Thanks! Nothing surprising but nonetheless interesting. I like the visual and interactive format.
 
Status
Closed Thread. (Continue Discussion of This Topic by Starting a New Thread.)
Back
Top Bottom